Agile Workshop – Pre-work

This content is password protected. To view it please enter your password below:

Behavioral and cultural maturity on Customer Centricity with maturity grid..

An unique attitude based organizational evaluation is used to understand behavioral and cultural maturity and can provide insights on where and what kind of attention is needed from leadership to improve Customer Centricity. Instead of dispersed efforts, they can take focused actions.

An overall maturity rating for the organization or cohort of employees will quantitatively assess current state.

A maturity grid below can give relative position and also provide a benchmark.

Customer Centricity Maturity Levels

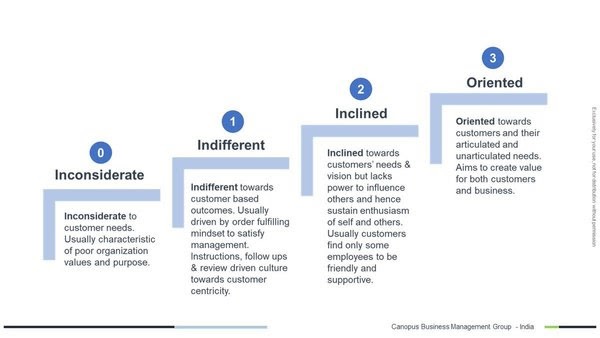
To arrive at this maturity level:

  • Customer Centricity of an organization across 8 dimensions is assessed and outcome will be an overall Customer Centricity Score against 4 maturity levels.
  • Unlike traditional assessments, in this survey participants’ attitude is evaluated by giving them 8 random scenarios and they have to select what they will do or feel in each of the situation. This way, it eliminates respondent bias.
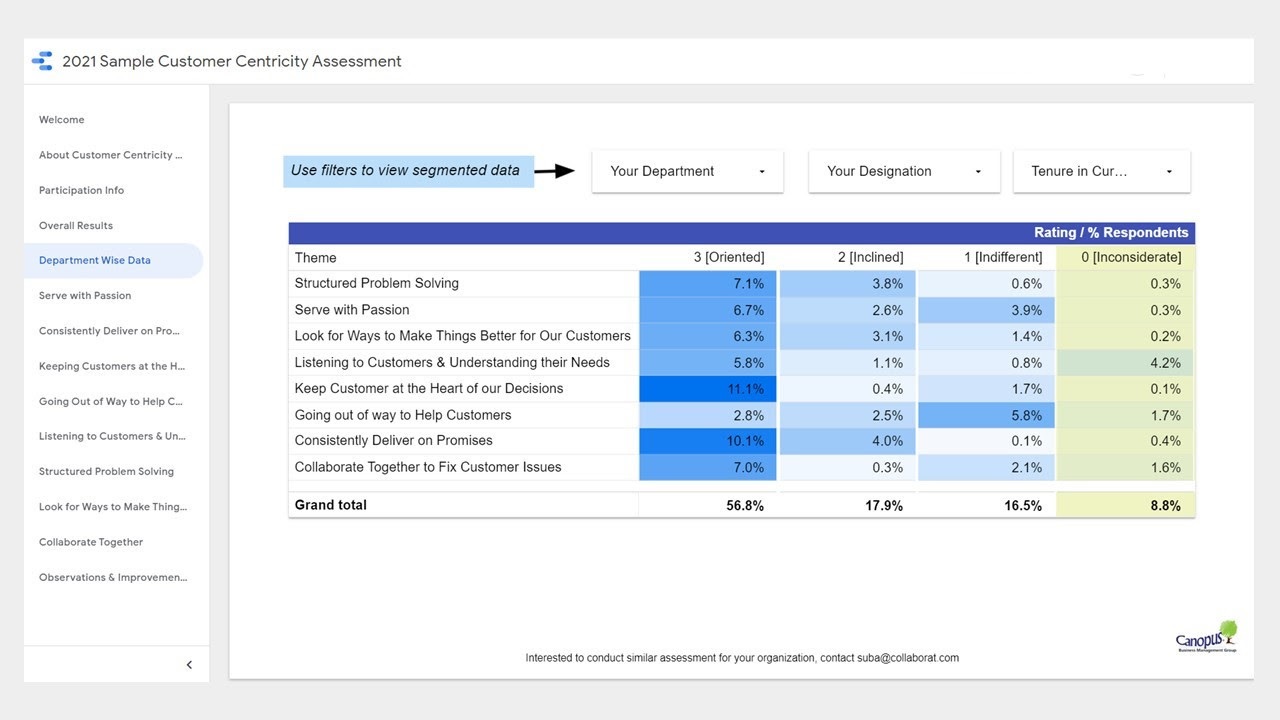
  • Outcome is compiled in an interactive Customer Centricity report – a dashboard

Access Customer Centricity Maturity Interactive Dashboard here

For organizations of employee headcount (20 – 80) this Customer Centricity Evaluation is free.

#nilakantasrinivasan-j #canopus-business-management-group #B2B-client-centric-growth #Customer-Centricity-Evaluation

Inspiration is contagious like COVID!

I’m an artist at living – my work of art is my life.

  – Suzuki

Be passionate about designing customer experience. Take personal interest in finer details of your product/service, even if its too insignificant for your role.

If a picture is worth 1000 words, a prototype is worth 1000 meetings.
    – Tom & David Kelley

It’s best to create a culture to experiment, test & pilot the hypothesis rather than deliberation, debate & finalize!

Mind is never a problem, mindset is.
     – Narendra Modi

All employees are good, any mind-block that makes someone pro or anti to a change is due to lack of clarity. Communicate beyond barriers to build strong bridges and change mindsets.

The more you engage with customers the clearer things become and the easier it is to determine what you should be doing.
     – John Russell 
Set it as your personal target to interact with at least 1 customer everyday, even if it is in an informal manner.
_____________________________________________________
A little rain each day will fill the rivers to overflowing.
   – Liberian Proverb
Leaders need to repeatedly and regularly connect with employees to emphasize the importance of customer experience. It’s not a one time fan fair event.
_____________________________________________________
The customer is not always right, but they are always your customer!
    – Shep Hyken
It doesn’t matter who’s right, any way. Not all customers will fit into ideal customer profile. This agile mindset is the starting point for customer delight.
_____________________________________________________
Don’t confuse customers who are to your company with customers who are loyal to your loyalty program.
   – Sky
Not all customers are loyal. Don’t get misled by rewards redemptions and impressions rates to gage customer engagement.
_____________________________________________________
Use your good judgment in all situations. There will be no additional rules.
 – Nordstrom’s employee manual
Processes, control measures, audits & automations should empower your employees to serve customers better and not meant to turn employees into robots that follow rule & script books.

#nilakantasrinivasan-j #canopus-business-management-group #B2B-client-centric-growth #Customer-Experience #Leadership-quotes

Triangulation can help sustaining solutions and strengthening analysis.

When your organization faces a problem, sooner or later, there will be an action plan in place to abet its elimination. The inconvenient truth about solutions is that they have long tails. Very, very few solutions actually stick. Most of them seem to be gone in months, sometimes even weeks and the problem bounces back. Yes, I’m talking about lack of permanence to the actions taken to improve performance.

There are several theories and in-depth research but, from my experience, I can say that things haven’t changed much in the last 2 decades. Whether it’s automation, change management, top-down push, leadership sponsorship, incentives, rewards, recognition or culture fix, all of them are marked by only a certain success rate.

My other post, On recurring problems, 3L 5W & what’s wrong with it… explains a method to identify system level root causes. Triangulation can be used for validation of root cause and to evaluate the effectiveness of any solution.

Validation through Triangulation

Triangulation is a method that involves combining multiple sources or methods to validate an analysis or its outcomes. We are used to taking a second opinion from another medical professional before committing to an incisional treatment. That is an everyday example of triangulation. The origin of triangulation dates back to Greek civilization. In the last 2 centuries, it is very commonly used in maritime navigation, civil engineering and surveying, where it relies on sound trigonometry. In fact our GPS uses this very same principle to establish the lat-long of a location. Triangulation is also a very popular research method to validate results, findings and even for monitoring the sustenance of interventions, such as social welfare initiatives. 

In business while validating root causes, triangulation comes very handy. If we can validate the root cause by more than one means, it strengthens our analysis and confidence in our actions. Financially too, it makes sense, as ROI is higher.

I consider Triangulation as it can also generate new and credible findings about a situation or phenomenon and can create new ways of looking at a situation or phenomenon. 

Interestingly, it helps to overcome human behavioral bias, which is the biggest spoiler when it comes to organizational deployment. It helps to explore and explain complex human behavior using a variety of methods and observers to offer a more balanced explanation for a phenomenon.

Customer Attrition Example for Triangulation:

Let’s say, your organization faces unusual customer attrition. In general, you will collect and analyze data of customer activity by segments, such as customer journey, cart abandonment, milestones or events, complaints, etc to identify the reasons for customer attrition. Using triangulation, you can consider parallel methods such as customer interviews and front line employee interviews. You will independently gain insights from these 3 different methods viz., data, customer interviews & employee interviews to validate the outcomes. The results can either converge, complement or diverge from each other.

Interpretation of Triangulation Results

When all the three sources conclude that customer attrition is because of poor product support, we call this Convergence. That is, the results of the different methods lead to the same conclusion. 

When all the three sources conclude that the customer attrition is because of poor product support, but in the customer interviews, we learn that customers prefer self-service which is a weak link of your product line, then triangulation has led to Complementarity.

When the three sources provide different outcomes, one pointing towards product support, another towards pricing and third towards customer behavior, then we are in a stalemate or Divergence. This is a concerning situation as it either highlights issues with the methods or with the very problem itself. 

Triangulation Options

Depending on the objectives, triangulation can be done at different levels:

  • Data Triangulation – Using different data sources to validate. Ex: Customer activity database vs Customer Satisfaction database
  • Method Triangulation – Using different methods to validate. Ex: Data Analysis Vs Customer Interviews
  • Investigator Triangulation – Using different individuals to validate there by eliminating appraiser bias

While triangulation offers many benefits, you have to be careful in selecting the right methods and planning the analysis. In general, it can consume more time that quick action mode, but will reduce failures, increase sustenance and success rates.

You can also consider triangulation for verifying sustenance of initiatives, selection of vendors or new employees

#nilakantasrinivasan-j #canopus-business-management-group #B2B-client-centric-growth #Triangulation

This content is password protected. To view it please enter your password below:

Welcome to your Navana Champion

3L 5Why Analysis

3L 5Why Analysis is synonymous with Root Cause Analysis nowadays with most organizations having knowledge and know-how to perform 5 Why analysis. Most leaders encourage their leaders to use 5 why analysis to identify the root cause. That’s the good news!

Now the bad news 🙁 Most of the 5 Why analysis are incomplete and provide only tactical means to the current situation. They hardly look at underlying system level causes. If you don’t agree, list down all those problems in your organization that have been occurring for more than 5 years now, manifesting itself in some form or the other, in spite of a series of efforts year on year to arrest it. I have noticed that after some time, there is an innate acceptance in the organization that this problem is like the seasonal flu, it will keep coming again and again, we can’t do much other than taking precautions and facing it’s aftermath. In corporate, such perennial problems start off a mill of finger pointing rituals targeting other functions, individuals, company policy, customers, and even competition.

A comprehensive 5 Why Analysis should identify the systemic root cause of any problem. Some problems don’t need deep analysis at system level. Depending on the severity and occurrence of a problem, it should be possible to prioritize energies in identification of System level root causes wherever required.

Are you looking for ‘Root Cause Analysis Boot Camp for Business Leaders’? To know more

3L 5Why analysis, represents 3 Level 5 Why analysis performed around the same symptom.
The 3 levels of the 5 Why analysis implies, performing 3 different 5 why analysis on the same problem from 3 different perspectives – 

  • Specific to the problem
  • Specific to the detection mechanism
  • Specific to the systemic issue

Here’s is how I use this method with my client projects and for coaching teams during my engagements (and it’s a little different from what others do with 3L 5 Why):

  1. Level 1 – Specific to the problem – Perform 5 Why analysis for the issue on hand. It can be related to customers, regulators, safety, quality , productivity or any other significant failure. Usually this is done by the people closest to the processes in question, essentially the doers and immediate team leaders. The purpose of this level 1 5 why analysis is to identify the root cause for why the problem on hand occurred. For ex: Lets say, your regulator has fined you for non-conformance in a standard laid out by them. Here, our focus will be on : Why did we get fined now?
  2. Level  2- Specific to the detection mechanism – Ideally this level of analysis has to be done by managers. They have laid out processes, controls, checks and balances to ensure critical issues are identified before it goes outside the organization. So the focus of this level of 5 why root cause analysis will be to identify the root causes for why the detection system allowed defects to pass downstream. Hence addressing this area will strengthen the control and governance system. For ex: Why did the transactions escape the automated checks, human checkers, approvers, auditors, process owners, etc
  3. Level 3 – Specific to the systemic issue – The last and highest level aims to look for systemic deficiencies that lead to the problem. From my experience, this requires a very good understanding of the entire value chain. Actually it also requires a candid acceptance of flaws in the enterprise such as culture issues, process deficiencies, silos, resourcing gap, ineffective leadership, etc. Ideal for senior leaders to deep dive to identify system level root causes. From my experience, this is best done at periodic intervals by combining the study of several similar L1 and L2 failures. Most of them converge to a handful of common system level root causes. Unfortunately, the hard hitting reality is that these are conveniently ignored. For ex, in the case of compliance issue we touched earlier, an example of system level cause is, employees are held accountable for their mistakes and it directly impacts their growth and C&B; And so most of them wish to cover up anything that occured, even if it was inadvertent. 

There are several practical strategies that need to be developed to improve the effectiveness of 3L 5 Why analysis depending on culture, know-how, sector, etc. 

Another important missing link to 3L 5Why analysis is the data based validation. It is almost impossible to get to the root cause by merely brainstorming. An ideal approach would be to use a triangulation method.

If you are looking for Lean Six Sigma Workshop/mentoring in Chennai, Bangalore, Mumbai, Delhi and across India, contact us.

#nilakantasrinivasan-j #canopus-business-management-group #B2B-client-centric-growth #3L-5Why-Analysis #5Why-Analysis

How to measure the ROI and effectiveness of Learning Programs?

Many learning interventions, whether they are simple training programs or complex workshops involving multiple touchpoints, fall short of getting sufficient endorsement from business leaders. There can be several reasons & those might vary case to case, but one of the biggest issues with learning engagements is lack of data and supporting analytics to back the effectiveness of intervention.

Most large enterprises allocate more than 25% of the enterprise’s L&D budget for Technical skills development employees and partners (field sales & service), that is, annual technical training spend per employee (including hidden costs) varies anywhere between INR50,000 to INR4,00,000 depending on nature of business (technical or non-technical).  

ROI & Effectiveness of L&D Interventions

Usually technical skills have a high direct impact on top line performance and customer’s perception about brand, product & service quality. Luckily, they are also one of the easiest candidates to assess ROI.

Some of the common questions that business leaders ask are:

  • How has the intervention helped in meeting business priorities? & How to isolate the effect of training?
  • What is the Return on Investment (ROI) on L&D Interventions?
  • How to measure the effectiveness of a training program?
  • What is the retention of knowledge after a few months of interventions?
  • Are we doing the right type of interventions? Should we design our interventions differently?

To this means, L&D leaders stumble on the following:

  • Link Learning Goals to Business Goals?
  • What to measure? How to analyze
  • How to measure effectiveness in the field?
  • How to differentiate between evaluating the learning interventions and the participants?

Kirk Patrick model for evaluating L&D interventions is a popular go-to technique for this program:

  • Kirk Patrick Model Level 1 – Measure Reaction – Gather training feedback
  • Kirk Patrick Model Level 2 – Learning – Evaluate participant knowledge and skills through post training assessment
  • Kirk Patrick Model Level 3 – Behaviors – New skills that participant gaining in training that is being used in field
  • Kirk Patrick Model Level 4 – Results or effectiveness – Business results directly relatable to the learning intervention

Obviously, all of them have their own pros and cons.

It is not possible to measure at Kirk Patrick Model L4 for all interventions and not necessary too.

As we live in a digital-data world, it lends itself to applying innovative methods and techniques to perform deep analysis and gain insights about the effectiveness of learning interventions and it improve learner’s engagement.

Here are few technology & analytics driven techniques:

  • Learning Pulse measurement
  • Descriptive Analytics & EDA to identify adoption issues
  • Reaction & Feedback Analytics
  • Verbatim Analytics using NLP models
  • A/B Testing Experiment design
  • Behavioral Analytics 
  • Analytics on sustenance 
  • Diagnostic Analytics  
  • Performance Modelling
  • Predictive Modelling learning
  • AR based learning assessments
Learning Analytics Online Course

And key steps to assessing ROI for L&D interventions are as follows:

  • Decision on evaluation method across learning life cycle (training design, during & after training)
  • Collecting Post-Training Data
  • Isolating the Effects of Training
  • Computing Monetary Value (Tangible, Preventive, etc) of training results
  • Computing Learning Cost
  • ROI Computation

Using a structured and well-thought through approach, L&D effectiveness and ROI can be improved drastically.

Drop us a line to know more and we’ll get back to you soon.

#nilakantasrinivasan-j #canopus-business-management-group #B2B-client-centric-growth #L&D

Data Based Mindsets – Maturity Levels

As of 2021, organizations have heavily invested in data infrastructure and supporting resources. But it’s grim to hear that nearly 85% of all data and analytics based transformation projects fail to meet their objectives.

There can be a long list of reasons for this state of affairs, but an undeniable contributor and a systematic issue is the organization’s culture – A lack of a Culture of Data Based Mindset.

Many times when we don’t know what is the problem with the organization, we tend to brand it as a cultural issue. So to say, the problem is attributed to Data Based Culture or lack of it, is a biased statement without going deeper into the issue.

The willingness of employees to accept & adapt to the new way of working. ie., taking decisions or actions based on data, is in fact the real barrier and reason for low adoption of data based transformation projects.


This is one of the new pillars of professional excellence – being fluent with data and making it an integral part of day to day actions.

Data Fluency, Data Literacy, Data based Mindset – whatever name we want to give, it boils down to how comfortable we are with data.

Like any other new technology – mobile, web applications, smart devices, social media, etc., we have a continuum of users of different maturity and proficiency in Data Based Mindset or Data Literacy too

Drop us a line to know more and we’ll get back to you soon.

If you wish to honestly self-assess or evaluate your team on where they stand when it comes to using data for decision making, a Data Based Mindset Maturity Model that covers data literacy maturity levels such as the one below will be very helpful. We’ll now look into the levels of Data Based Mindsets:

Data Based Mindsets - Maturity Levels

Resist – confused beginners

At this level, at heart, an individual is a disbeliever in data based decision making. Such individuals would hardly look into data but when they do so, they try to run a variety of logical counter-arguments to discredit data and its insights. One can say that they have a strong belief system that is anti-data or facts, which is based on biases, preconceived ideas of the situation, hear-say facts, anecdotal evidence, etc. Folks at this level offer maximum resistance to change. At the deepest level, it can be on account of fear of some kind. When an organization has many key stakeholders and king-pins in this bucket, the organization would more or less be a data-laggard. Ultimately they will have to take off from this level due to peer pressure and so ‘confused beginners’ is a fitting description for this group. 

Access – social drinkers

At this second level, individuals are limited users of data, only based on necessity. I’m tempted to compare them with ‘social drinkers’. Situations and environment forces them to consider data and they do so with reluctance. Naturally, they are users with limited proficiency in data handling and are uncomfortable when placed in data rich discussions.

User – consumers and cheerleaders

Bulk of employees in organizations that are doing well today, fall into this group. They believe in data based decisions. So there is no mental block with this group. But they have skill limitations. I’m tempted to compare them with the audience and cheerleaders in a football match. They love the game, they enjoy and relish talking about it in great detail but they’ll always be in the stands and never put their foot on the playground. Either they don’t have the skill to play or they are too old or not physically fit for the sport. But being here is not that bad from an organization’s perspective. They are willing to consume data and inferences given to them and believe in it.

Understand – power users

They are individuals who have good expertise and are strong believers in data. They lead with data, whether it is about analysis, framing scenarios, statistical and probabilistic analysis, considering divergent views from data, they are very proficient. You can take them as ‘power users’. At extreme, they may tend to be ‘annoying experts’ too :-). 

Create – prosumer

Standing at the highest maturity, this group may not be really senior in organizational hierarchy, but they definitely are good at synthesizing deep insights from data, applying unconventional & innovative methods to generate unique value propositions for business and customers that can disrupt the current state. They look through the data beyond the obvious. You can call them the ‘prosumer’. They are both the producers of insights and its consumers. As a result, they are the trend setters. Obviously there are going to be only a few fitting into this group. 

This understanding of the Data Based Mindsets & Maturity Levels can be applied to evaluate its relevance to your industry, specific roles & departments and their ideal maturity states, skills needed and critical mass needed at each level to build a Data Based Mindset Culture, etc. 

If you wish to learn more about evaluating your organization on Data Based Mindsets & Maturity Levels or create a roadmap, feel free to contact us. 

If you are looking for Data Analytics Workshop in Chennai, Bangalore, Mumbai, Delhi and across India, contact us.

#nilakantasrinivasan-j #canopus-business-management-group #B2B-client-centric-growth #Data-Based-Mindset #Maturity-models

Sign-up for collaborat newsletter