The Y-shaped matrix is a matrix diagram that relates three sets of elements where one set is related to the other two sets in a circular manner. . It can be formed by bending the columns of sets A and B in the T-matrix in such a way that there is an interrelation between the elements of these two sets.
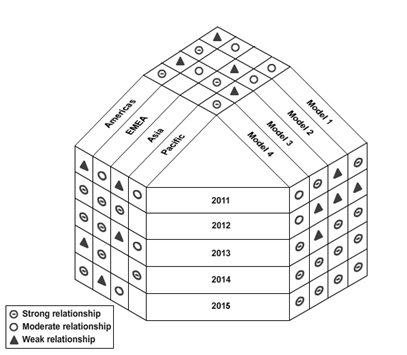
Fig: A Y-shaped matrix that summarizes the requirements for different models of photocopiers
Both DFMEA and PFMEA have similar principles and follow identical steps. Both involve identifying potential failures, their impact, and corrective measures to be taken for reducing or eliminating these potential failures
However, DFMEA and PFMEA differ in a few aspects, such as their focus and the stage in which these two analyses are done.
DFMEA focuses on potential failures related to product design changes. The main focus is on finding potential failures that can result in malfunctions and safety hazards while using the product. It is also applied to identify potential causes that may curtail the life of the product. It must be conducted throughout the entire design process, starting at the preliminary design as soon as the design concept has been selected to the production.
PFMEA focus on potential failures associated with processes and changes to them. The main focus is on finding potential failures related to a process that can affect the quality of a product or cause safety or environmental hazards and result in customer dissatisfaction. It is also applied to identify potential causes that reduce the reliability of the process.
| Item | Description |
| Focus |
|
| Stage |
|
- Improving quality to stay ahead of competition in the market. This is done by capturing customer requirements and redesigning operational processes to meet those requirements.
- Eliminating waste to make processes more efficient. This is done by eliminating activities that do not add any value to the product or service.
- Reducing variabilities and inconsistencies by standardizing processes and outputs.
- And, reducing costs by ensuring that production does not exceed customer demands. By preventing overproduction, organizations can also make sure that inventory costs do not increase.
| Principle | Description |
| Value | Defining the value |
| Value stream | Identifying the value stream |
| Flow | Creating flow in the value stream |
| Pull | Creating pull in the value stream |
| Perfection | Creating a continuous improvement culture |
| Leveling | Creating a balanced workflow |
| Standardized processes | Developing standards and following them |
| Kanban | Using a visual signaling system |
| Visual control | Using visual control methods |
| Quick changeover | Enabling the reduction of time |
| Defect prevention | Reducing the cost of poor quality |
Visual Factory in “Daily Work Management System For Managers Using Lean Methods”
In a Lean manufacturing process, time and resources spent on conveying data and information are regarded as waste. Visual factory tools—such as signs, charts, check sheets, and more— simplify information and reduce resources and time consumed to make it accessible.
Clear and concise real-time information and feedback regarding the status of a plant or a process is provided to shop floor employees using visual cues and tools. The visual cues provide unambiguous information needed to perform their jobs at a glance. Simple visual cues—such as color-coded pipes, wires, or flags; painted floor areas; and indicator lights—are simple to use and understand. The type of tool and the location used are determined by identifying the relevance and the information recipient.
Sign-up for collaborat newsletter