Strategy Canvas of Blue Ocean Strategy
Blue Ocean strategy shapes strategic structure to create new demand and generate high growth for the company. To create such a strategy, there are a set of analytical tools and frameworks used in formulating and executing it. The first and foremost tool in value innovation and creation of blue ocean strategy is the strategy canvas.
Also known as Snake Plot, the basic component of strategy canvas is value curve that is nothing but a graphical form of company & competition’s current state of play in the known market. This mapping makes us understand where the competition is currently focusing, the factors that the industry competes in selling its products, service and delivery and what the customers receive from the existing competitive offering on the market. Strategy canvas helps us to reconstruct the buyer value essentials by questioning its existing industry’s strategy and business model by shifting our focus from competitors to alternatives and from customers to non-customers of the industry thus making a trade-off between value and cost. It tells the story in one page.
How to read a value curve of strategy canvas?
The horizontal axis captures the key factors the industry competes on and invests in. The vertical axis of the strategy canvas is a rating scale that captures the current state of play of key competing factors
How strategy canvas is created?
Key factors are those value creating components a company invests in resources, processes and capabilities and involves strategic choices and impacts strategic purpose. To know the key elements the team has to do extensive research and analysis within the organization as well as outside, interactions with customers about the product, service and delivery. After determining the key elements, the team has to give rating to these elements. The rating given may be relatively low, low, medium, high, relatively high etc. The rating given to each key factor must be fair and unbiased. Let us consider an example from the professional development and education sector.

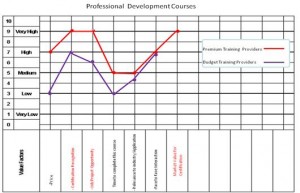
The above graphical depiction shows the professional development courses offered by the premium training providers and budget training providers. The horizontal axis has the key factor such as price, certification recognition, job/project opportunity, time to complete this course, relevance to industry/application, face to face interaction and market value for certification. The vertical axis shows the relative value buyers receive across all these key competing factors. For example, premium providers price their product/service higher than budget providers and so on.
Thus by preparing the strategic canvas the company is ready to explore how to redraw its strategy to create blue ocean. It forms the basis of value creation and value capture for a company and helps in creating value innovation.
The strategic canvas can be constructed for different strategic groups (organizations that differentiate themselves by pricing) or between the organization and its competitors.
The primary difference is in the application of strategic canvas after its creation. In case of Blue Ocean Strategy, the next step is to include substitutes and alternatives in the canvas rather than mean competitors within the industry. After inclusion, the team uses the 4 action framework to create Blue Oceans.
