What are Affinity Diagrams?
An affinity diagram is a tool that is used to organize a large number of ideas, opinions, and issues and group them based on their relationships. Affinity diagrams are generally used for categorizing ideas that are generated during brainstorming sessions and can be particularly useful for analyzing complex issues. Buy Canopus LSS YB Certification Online Course Click […]
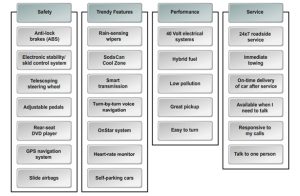
CTQ Attributes
Some of the major attributes of CTQ include: A single meaning for each metric across all geographic locations. Defining the process owners who are responsible for tracking the CTQ. Clearly defined defects and opportunities in the process. A consistent measurement system to provide accurate and precise measurements. And, it must be derived from the VOC […]
What are the sources of improvement projects?
Six Sigma projects are primarily focused on customers. The other areas that Six Sigma projects focus on are: Improving survey and custom Improving the performance of Critical to Quality (CTQ) Reducing the number of complaints from customers. Reducing in-process or internal defects. Reducing warranty claims. er research scores. Capturing feedback from staff members effectively. Increasing profits […]
Project metrics – Primary Metrics and Secondary Metrics
The metrics of a Six Sigma project reflect customer needs and ensure that the internal metrics of the organization are achieved. The selection of project metrics is one of the crucial elements in the Define phase of the Six Sigma methodology. Six Sigma project metrics can be categorized into primary metrics and secondary metrics. Primary […]
Interrelationship Digraphs
An interrelationship digraph, also called a relations diagram or network diagram, is a tool that depicts relationships among different elements, areas, or processes through a network of boxes and arrows. It is usually used by Six Sigma teams to understand cause-and-effect relationships among different factors of a problem. Different factors associated with a problem are entered in boxes or written […]
Prioritization Matrix
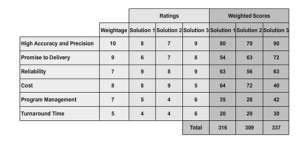
In the previous topic, you created a tree diagram. Key issues identified must also be sorted in the order of their importance. A prioritization matrix helps determine the order for dealing with different issues or selecting solutions according to their relative importance. In this topic, you will create a prioritization matrix to identify crucial issues […]
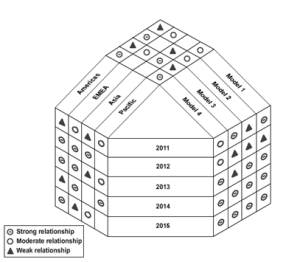
What are Matrix Diagrams?
A matrix diagram, also called a matrix chart, is a management and planning tool used for identifying relationships between two to four groups of elements or among elements in a single group. The elements in different groups are placed in rows and columns and relationships among them are analyzed by the team. Buy Canopus LSS YB Certification Online Course […]
Different types of Matrix Diagrams
Matrix diagrams can be sorted into several types depending on the number of data sets being compared. L-shaped Relates two sets of elements to one another or a single set of elements to itself. T-shaped Relates three sets of elements where there is no relation between the two sets that are related to a common set. Y-shaped Relates […]
What is Y-Shaped Matrix Diagram?
The Y-shaped matrix is a matrix diagram that relates three sets of elements where one set is related to the other two sets in a circular manner. . It can be formed by bending the columns of sets A and B in the T-matrix in such a way that there is an interrelation between the elements of […]
DFMEA and PFMEA
Both DFMEA and PFMEA have similar principles and follow identical steps. Both involve identifying potential failures, their impact, and corrective measures to be taken for reducing or eliminating these potential failures However, DFMEA and PFMEA differ in a few aspects, such as their focus and the stage in which these two analyses are done. DFMEA focuses […]
Goals & Principles of Lean?
Lean manufacturing has a few important goals, which have led many industries to implement. Lean in their production processes. The goals include: Improving quality to stay ahead of competition in the market. This is done by capturing customer requirements and redesigning operational processes to meet those requirements. Eliminating waste to make processes more efficient. This […]
What is Visual Factory?
Visual Factory in “Daily Work Management System For Managers Using Lean Methods” In a Lean manufacturing process, time and resources spent on conveying data and information are regarded as waste. Visual factory tools—such as signs, charts, check sheets, and more— simplify information and reduce resources and time consumed to make it accessible. Clear and […]